📊 Bitcoin Price Projections Based on Asset Class Market Caps
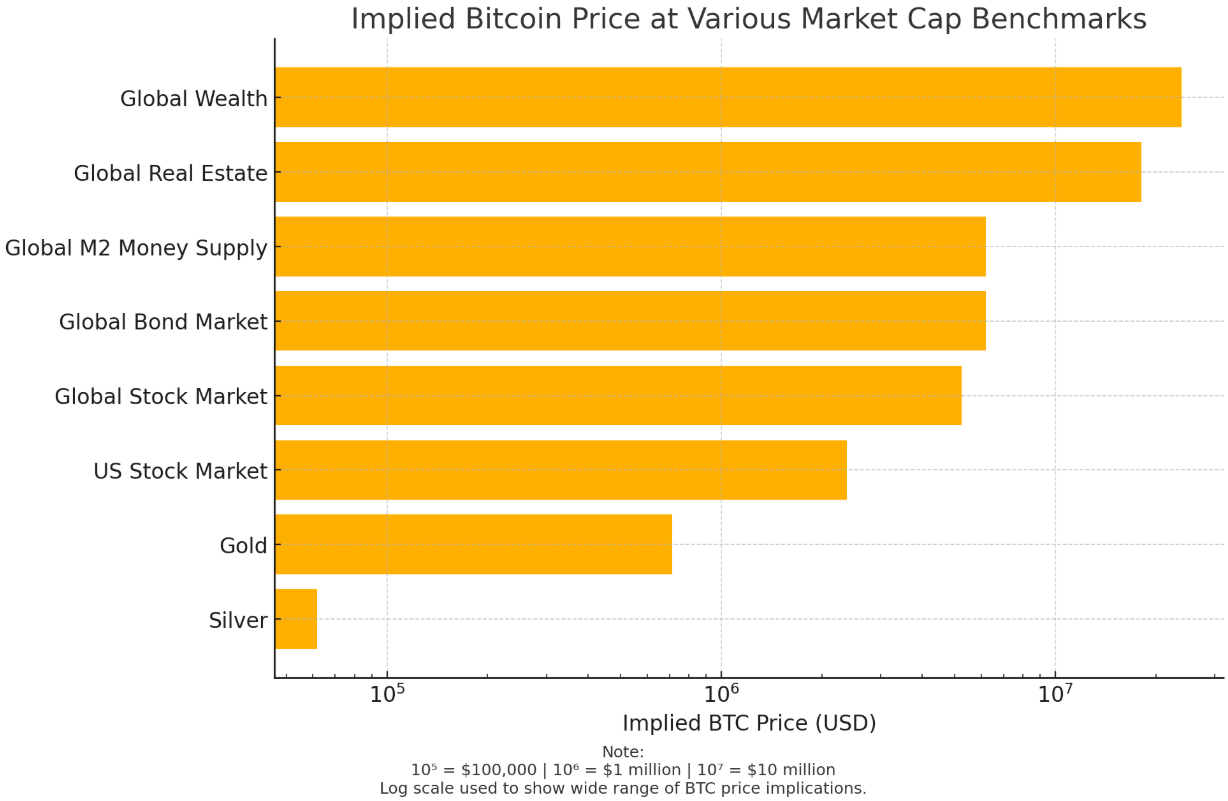
This chart visualises what the price of 1 Bitcoin (BTC) would be if Bitcoin’s total market cap grew to match various global asset classes.
Bitcoin’s supply is fixed at 21 million coins, making it inherently scarce. As demand grows and market adoption increases, Bitcoin’s market cap could—hypothetically—compete with other major stores of value.
💰 Asset Classes and Corresponding Implied BTC Prices
| Asset Class | Approx. Market Cap (USD) | Implied BTC Price |
|---|---|---|
| Silver | $1.3 trillion | ~$61,900 |
| Gold | $15 trillion | ~$714,000 |
| US Stock Market | $50 trillion | ~$2.38 million |
| Global Stock Market | $110 trillion | ~$5.23 million |
| Global Bond Market | $130 trillion | ~$6.19 million |
| Global M2 Money Supply | $130 trillion | ~$6.19 million |
| Global Real Estate | $380 trillion | ~$18.1 million |
| Total Global Wealth | $500 trillion | ~$23.8 million |
🧮 Calculation Method
Each BTC price is calculated by:
Implied BTC Price=Asset Class Market Cap21,000,000\text{Implied BTC Price} = \frac{\text{Asset Class Market Cap}}{21,000,000}Implied BTC Price=21,000,000Asset Class Market Cap
For example:
If Bitcoin reaches the size of gold’s market cap:
$15,000,000,000,000÷21,000,000≈$714,285\$15,000,000,000,000 ÷ 21,000,000 ≈ \$714,285$15,000,000,000,000÷21,000,000≈$714,285
🔢 Reading the Chart Scale
The X-axis uses a logarithmic scale to accommodate the wide price range:
-
10⁵ = $100,000
-
10⁶ = $1 million
-
10⁷ = $10 million
This helps show smaller values like silver without visually flattening the higher targets like real estate or global wealth.
🧠 Key Insight
Even reaching 10% of gold’s market cap would imply a BTC price over $70,000 — already within historical highs. The long-term upside remains significant due to Bitcoin’s absolute scarcity and growing global adoption.
No comments to display
No comments to display