# 📊 Bitcoin Price Projections Based on Asset Class Market Caps
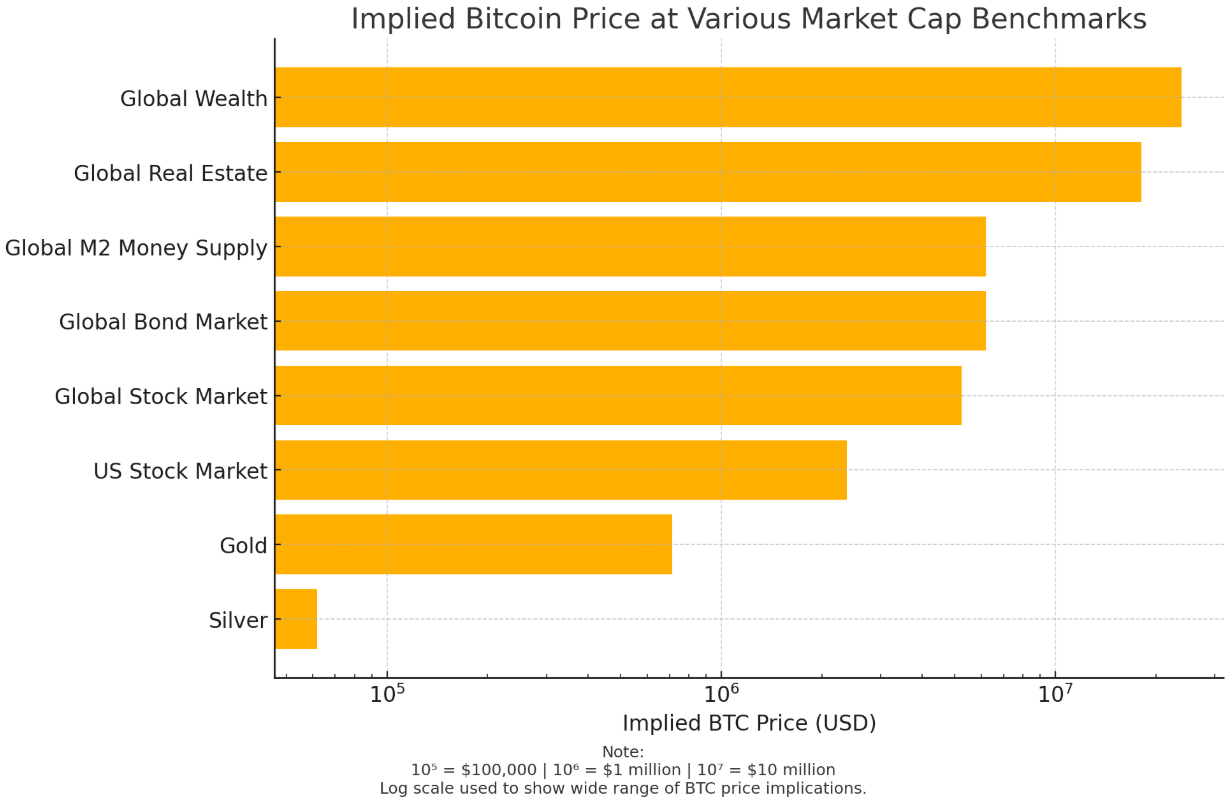
This chart visualises what the **price of 1 Bitcoin (BTC)** would be if Bitcoin’s total market cap grew to match various global asset classes.
Bitcoin’s supply is **fixed at 21 million coins**, making it inherently scarce. As demand grows and market adoption increases, Bitcoin’s market cap could—hypothetically—compete with other major stores of value.
[](https://inkflow.cloud/uploads/images/gallery/2025-06/image.png)
---
### 💰 Asset Classes and Corresponding Implied BTC Prices
| Asset Class | Approx. Market Cap (USD) | Implied BTC Price |
|---|
| Silver | $1.3 trillion | ~$61,900 |
| Gold | $15 trillion | ~$714,000 |
| US Stock Market | $50 trillion | ~$2.38 million |
| Global Stock Market | $110 trillion | ~$5.23 million |
| Global Bond Market | $130 trillion | ~$6.19 million |
| Global M2 Money Supply | $130 trillion | ~$6.19 million |
| Global Real Estate | $380 trillion | ~$18.1 million |
| Total Global Wealth | $500 trillion | ~$23.8 million |