Technical Analysis
🔍 What Is Technical Analysis
Technical analysis uses historical price data and chart patterns to predict future market behaviour. Unlike fundamental analysis (which evaluates a company’s intrinsic value), technical analysis is all about price action, momentum, and timing trades.
Introduciton-to-Technical-Analysis.pdf
📊 Reading Candlestick Charts
Candlestick charts provide 5 key data points:
-
Open
-
Close
-
High of Day (HOD)
-
Low of Day (LOD)
-
Direction of movement (bullish or bearish)
Each candlestick represents a fixed time (e.g., 1 day, 1 hour, etc.). Longer timeframes usually offer more reliable trends.
✅ Recommended Tool:
tradingview.com for real-time candlestick charts.
⚓ Support and Resistance
-
Support = historical buying zones (price bounces up)
-
Resistance = historical selling zones (price bounces down)
-
Once broken, these levels often flip roles.
🕯️ Common Candlestick Patterns
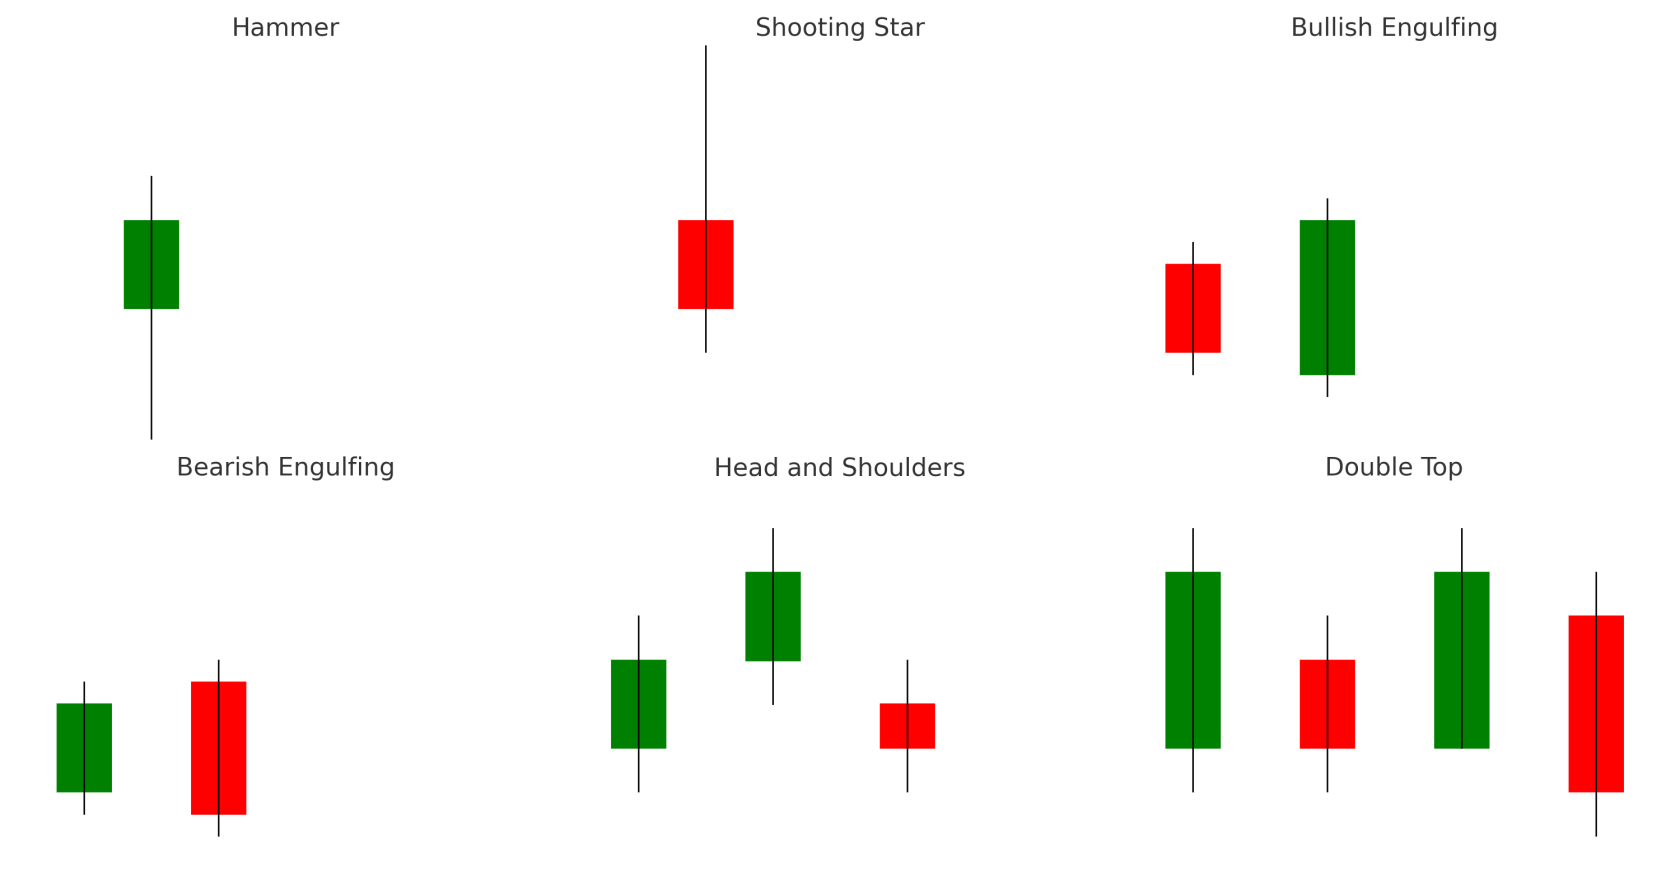

1. Hammer
-
Green candle, long lower wick
-
Indicates bullish reversal
2. Shooting Star
-
Red candle, long upper wick
-
Indicates bearish reversal
3. Bullish Engulfing
-
Large green candle completely engulfs prior red candle
-
Signals buyer dominance
4. Bearish Engulfing
-
Large red candle completely engulfs prior green candle
-
Signals seller dominance
📈 Common Chart Patterns
1. Head and Shoulders
-
Indicates trend reversal from uptrend to downtrend
-
Inverse pattern signals reversal into an uptrend
2. Double Top & Double Bottom
-
Double Top = Bearish (two peaks)
-
Double Bottom = Bullish (two troughs)
📉 Key Technical Indicators
1. RSI (Relative Strength Index)
-
Measures momentum (0–100 scale)
-
Overbought: above 70
-
Oversold: below 30
-
Divergence between RSI and price can signal trend reversals.
2. MACD (Moving Average Convergence Divergence)
-
Uses EMAs (12-period & 26-period) to track trend momentum
-
Crossovers indicate potential buy/sell signals
3. Bollinger Bands
-
Based on SMA and standard deviation
-
Bands contract = low volatility
-
Bands expand = high volatility
-
Best for identifying breakouts or "squeeze" conditions
💡 Final Tips
-
Combine 3–5 indicators for higher probability trades
-
Always use stop-losses
-
Patterns are not always reliable, use confluence
-
Technical analysis works best when multiple signals align
Further reading
No comments to display
No comments to display