Technical Analysis
A practical guide to reading charts, identifying trends, and using technical indicators to forecast market movements and develop trading strategies. Ideal for traders seeking to enhance decision-making and manage risk effectively.
Technical Analysis
🔍 What Is Technical Analysis
Technical analysis uses historical price data and chart patterns to predict future market behaviour. Unlike fundamental analysis (which evaluates a company’s intrinsic value), technical analysis is all about price action, momentum, and timing trades.
Introduciton-to-Technical-Analysis.pdf
📊 Reading Candlestick Charts
Candlestick charts provide 5 key data points:
-
Open
-
Close
-
High of Day (HOD)
-
Low of Day (LOD)
-
Direction of movement (bullish or bearish)
Each candlestick represents a fixed time (e.g., 1 day, 1 hour, etc.). Longer timeframes usually offer more reliable trends.
✅ Recommended Tool:
tradingview.com for real-time candlestick charts.
⚓ Support and Resistance
-
Support = historical buying zones (price bounces up)
-
Resistance = historical selling zones (price bounces down)
-
Once broken, these levels often flip roles.
🕯️ Common Candlestick Patterns

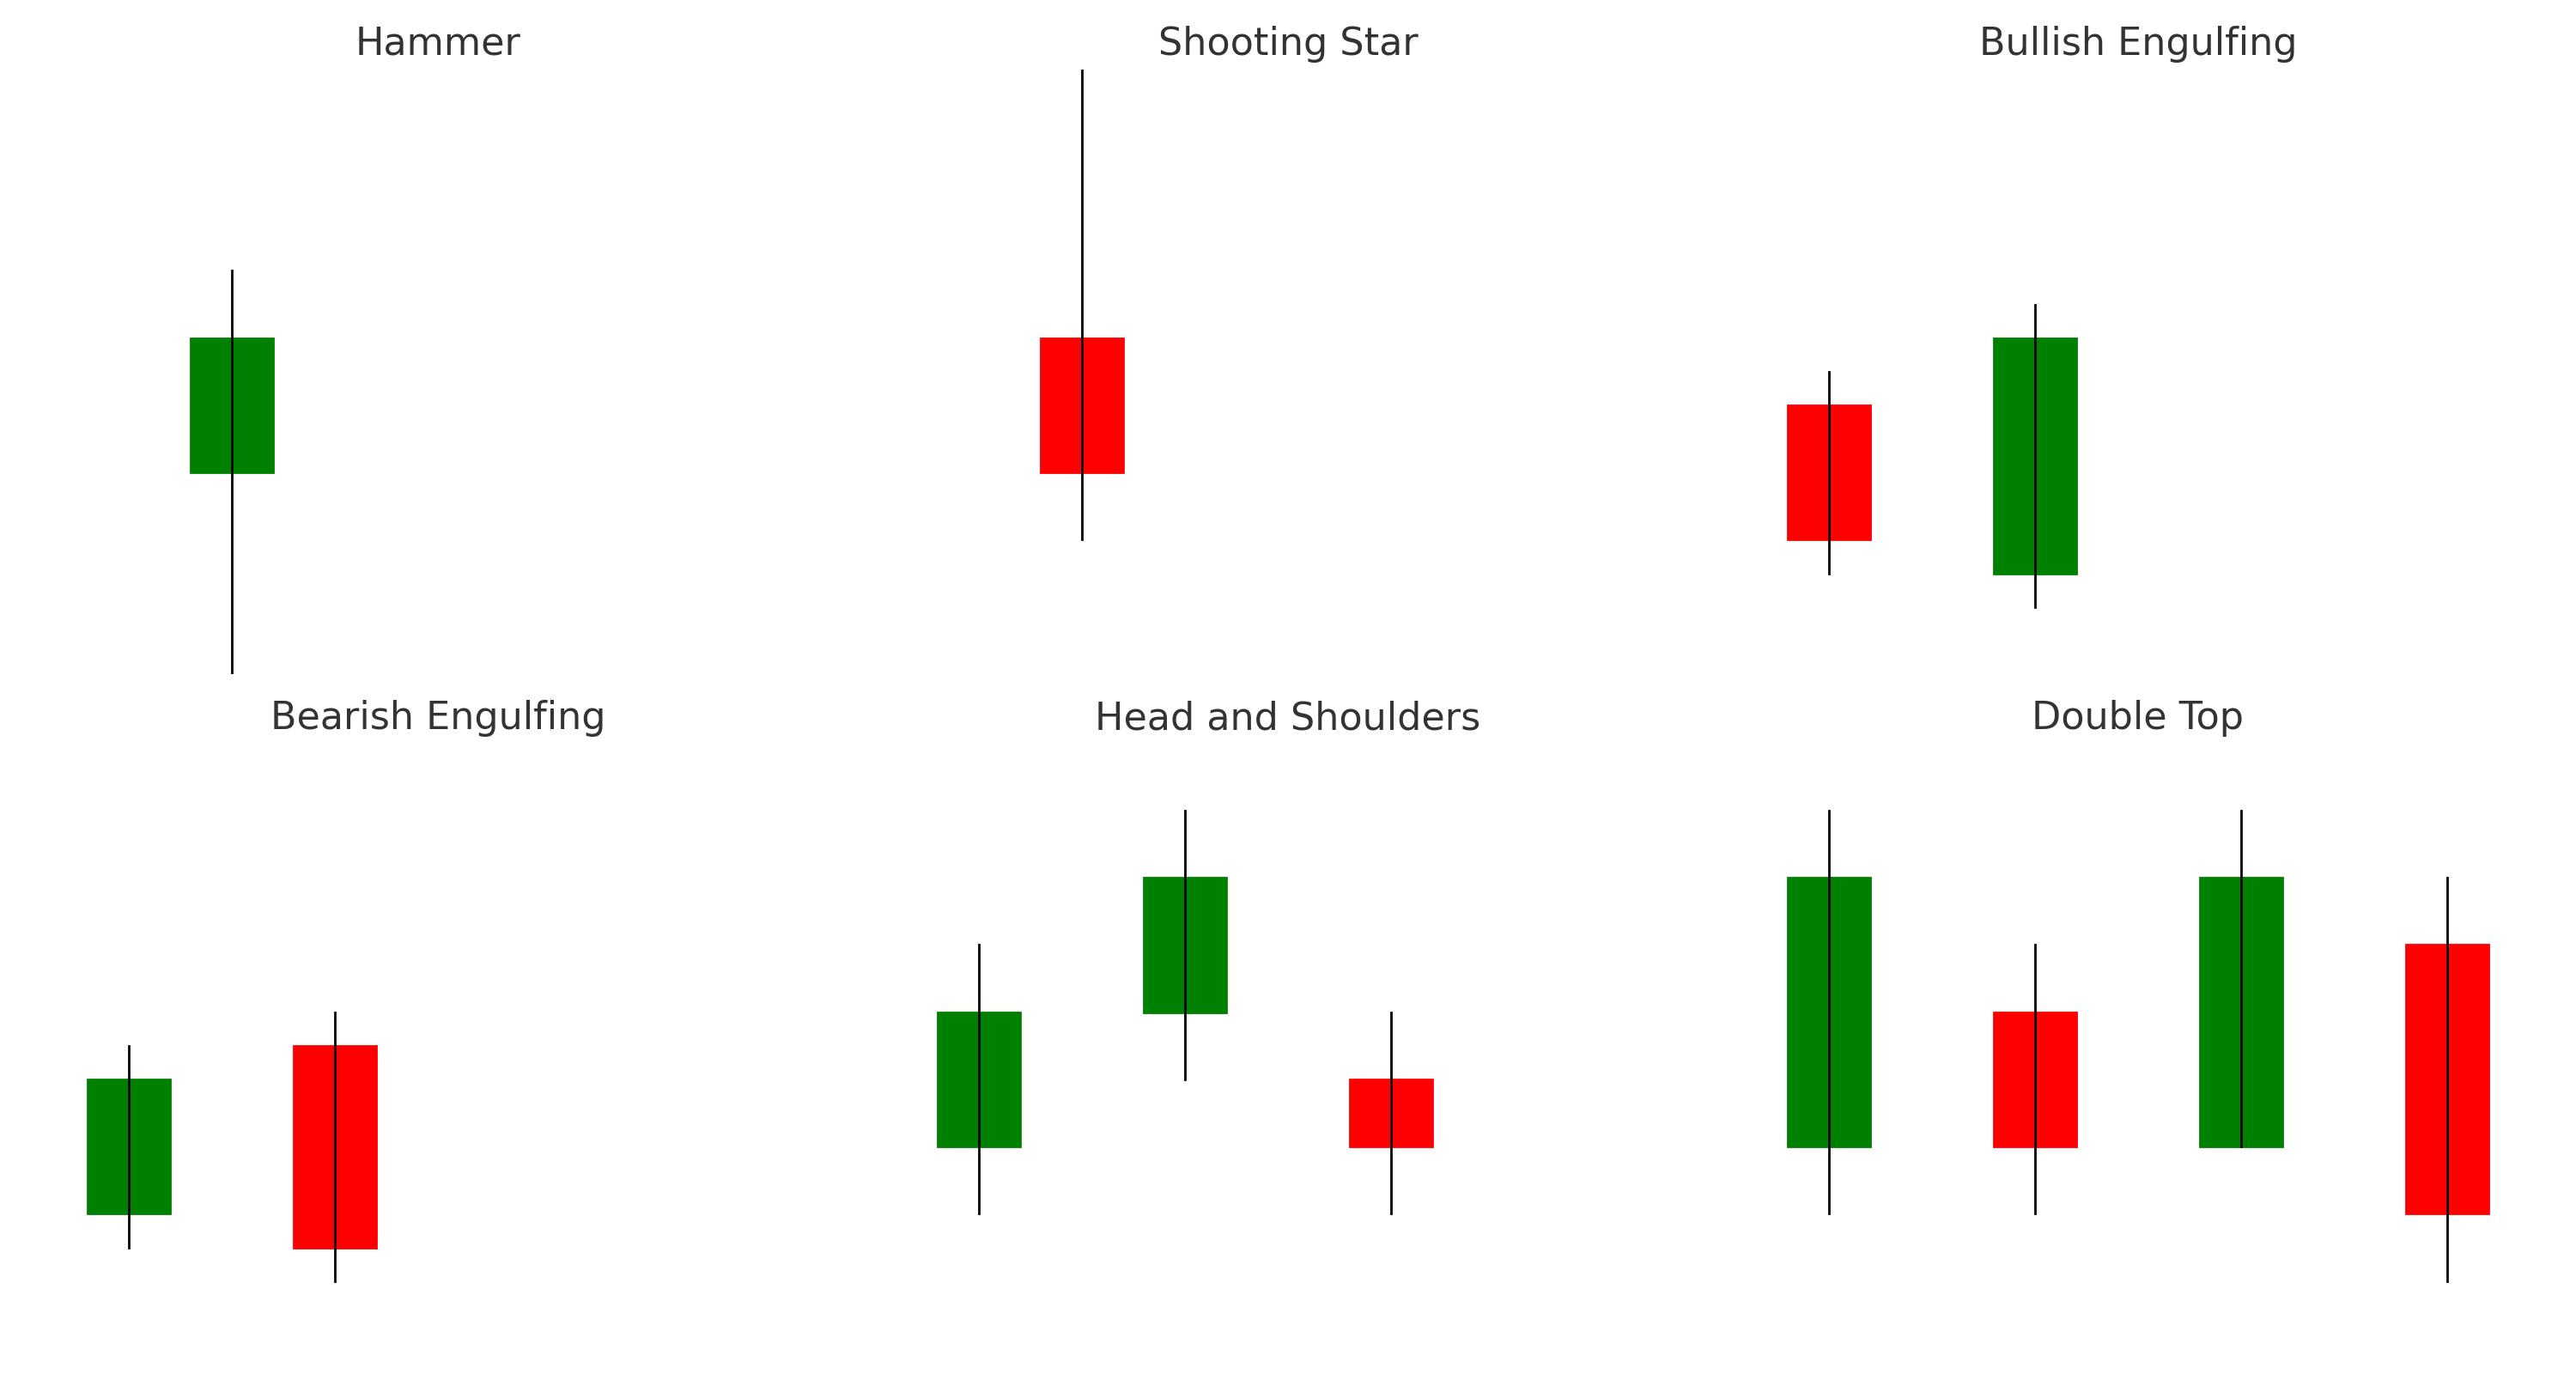
1. Hammer
-
Green candle, long lower wick
-
Indicates bullish reversal
2. Shooting Star
-
Red candle, long upper wick
-
Indicates bearish reversal
3. Bullish Engulfing
-
Large green candle completely engulfs prior red candle
-
Signals buyer dominance
4. Bearish Engulfing
-
Large red candle completely engulfs prior green candle
-
Signals seller dominance
📈 Common Chart Patterns
1. Head and Shoulders
-
Indicates trend reversal from uptrend to downtrend
-
Inverse pattern signals reversal into an uptrend
2. Double Top & Double Bottom
-
Double Top = Bearish (two peaks)
-
Double Bottom = Bullish (two troughs)
📉 Key Technical Indicators
1. RSI (Relative Strength Index)
-
Measures momentum (0–100 scale)
-
Overbought: above 70
-
Oversold: below 30
-
Divergence between RSI and price can signal trend reversals.
2. MACD (Moving Average Convergence Divergence)
-
Uses EMAs (12-period & 26-period) to track trend momentum
-
Crossovers indicate potential buy/sell signals
3. Bollinger Bands
-
Based on SMA and standard deviation
-
Bands contract = low volatility
-
Bands expand = high volatility
-
Best for identifying breakouts or "squeeze" conditions
💡 Final Tips
-
Combine 3–5 indicators for higher probability trades
-
Always use stop-losses
-
Patterns are not always reliable, use confluence
-
Technical analysis works best when multiple signals align
Further reading
Understanding the Pi Cycle
Understanding the Pi Cycle Top Prediction Indicator
The Pi Cycle Top Prediction indicator enhances its predecessor by projecting future crossover points of two key moving averages:
- 111-day Moving Average (111DMA)
- 350-day Moving Average multiplied by two (350DMA x2)
The indicator uses the rate of change of these moving averages over the past 14 days to extrapolate when they might cross, signalling a potential market top. Historically, such crossovers have accurately identified Bitcoin’s cycle tops, with previous predictions being within three days of actual peaks.
Implications for Market Behaviour
When the 111DMA nears the 350DMA x2, it indicates unsustainable price growth, often driven by speculation. A crossover typically signals the end of a bull market, leading to a price correction or bear market. This tool is crucial for professional investors as a risk management measure, helping them assess and adjust their market exposure during overheating periods.
Key Prediction: September 17, 2025
The indicator currently predicts a crossover on September 17, 2025, signalling a potential market top. Investors can track this projection on the Bitcoin Magazine Pro platform.
Origins and Related Tools
The tool was developed by Matt Crosby, Lead Analyst at Bitcoin Magazine Pro, building on the original Pi Cycle Top indicator by Philip Swift, which has a strong record of identifying market peaks. Related tools include:
- The Original Pi Cycle Top Indicator
- The Pi Cycle Top and Bottom Indicator
A detailed video explainer by Matt Crosby is available for further insights.
Importance for Professional Investors
In a volatile market like Bitcoin, the Pi Cycle Top Prediction chart offers:
- Data-driven insights for better portfolio management
- Precise timing to estimate cycle tops accurately
- Risk mitigation through early warning of market overheating
As institutional adoption grows, such predictive tools become essential for navigating Bitcoin’s unique market cycles, improving long-term investment outcomes.
Source: Bitcoin Magazine - Pi Cycle Top Prediction